
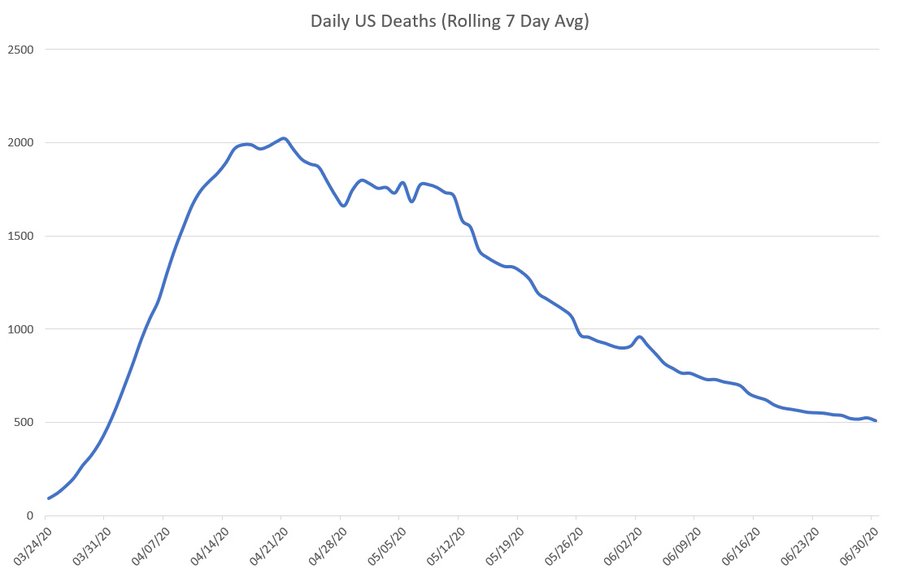
A Story of 2 Americas: Daily deaths in 2 groups US-A: These were hit hard early on – NY, NJ, Il, MI, CT, MA, RI, DE, MD, LA, PA, DC, IN US-B: The rest of the country which wasn’t hit very badly early on but with increasing cases Overall, the US looks like this:
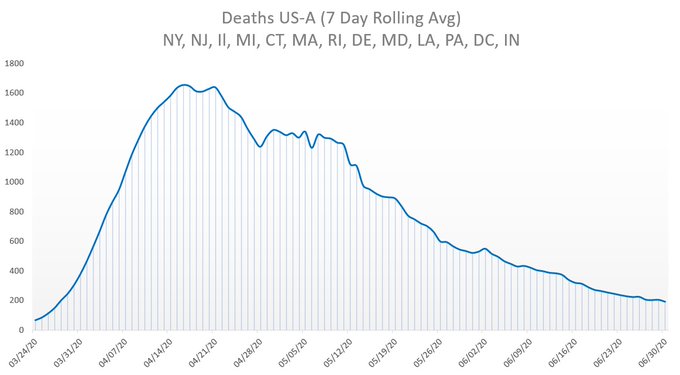
First up – US-A Represents 29% of US Population Looks like a typical Gompertz curve Huge growth early followed by long decrease Looks alot like the overall curve.
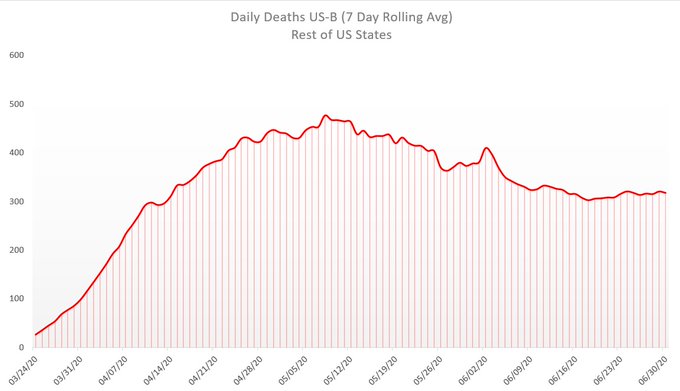
econd – US-B Represents 71% of population A more gradual rise in deaths followed by a slow decline and then a plateau These are the states that the MSM is freaking out about the rise in cases, but no significant increases in death.
But if we look at them side by side, another picture emerges US-A- despite representing only 29% of the US population, it represents 70% of all deaths. Good news is that Covid almost burned out here US-B- This curve is already flat! How much more do u want to flatten it?
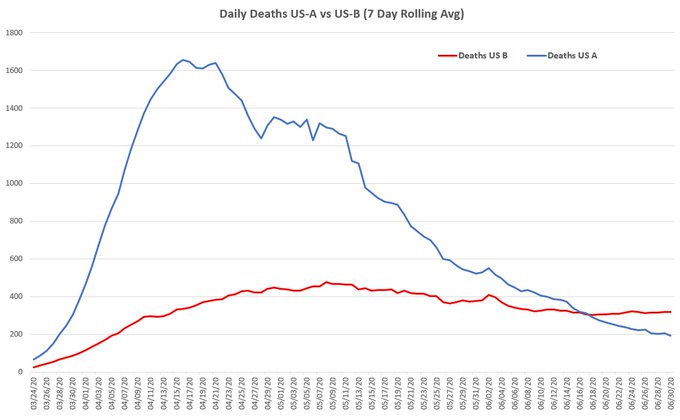
Conclusions: -The data does not match the panic…I’ve been hearing “wait two weeks” for about 3 weeks now. -Anybody talking about cases is disingenuous -The US-B curve doesn’t need flattening
About the Author




A southern democrat.
Hey "Bob" I take your comment as if this was coming from an idiot. How about using your real name…
A free ride to a polling place to act like an American. Of course someone has an issue with it.
They are simply Road Pirates, nothing more, nothing less.
Unwanted gentrification without proper assimilation.