Thursday, Cape Charles Town Council was briefed by the current Resilience & Adaptation Feasibility Tool (The RAFT) team from the William & Mary Virginia Coastal Policy Center and Old Dominion University. RAFT is a multi-university, inter-disciplinary academic partnership that is working to create an assessment and response decision framework to assist coastal communities in evaluating risks to coastal flooding, prioritizing action to increase resilience, and identifying sources of technical assistance and funding.
Cape Charles is one of three pilot communities participating in the RAFT project which will assess environmental, social, and economic resilience of the town.
What is resilience? According to the RAFT team, it is the capacity of a community to respond to, withstand, recover from, and thrive after both acute and chronic adverse situations.
The RAFT scorecard measures:
- Policy, Leadership, and Legislation
- Future Risk and Current Infrastructure Assessment
- Finance, Budgeting, Funding, and Economics
- Land Use
- Community Engagement
- Community Health and Wellness
- Ecosystems and Natural Resources
CORRECTION: Town Planner Larry DiRe sent in the following correction and data. The numbers next to the priority list represent the number of votes (literally done by placing dots next to the item choices during the June 26, 2017 workshop) received as a priority item. They do not represent the community rating score (CRS) which is 9. One of the RAFT goals is to lower that CRS score. As stated at the meeting the lowest (scaled from highest 10 to lowest 1) CRS score for any jurisdiction in Virginia is 6. Hope this helps, and please feel free to contact my office if you have any questions or require more information.
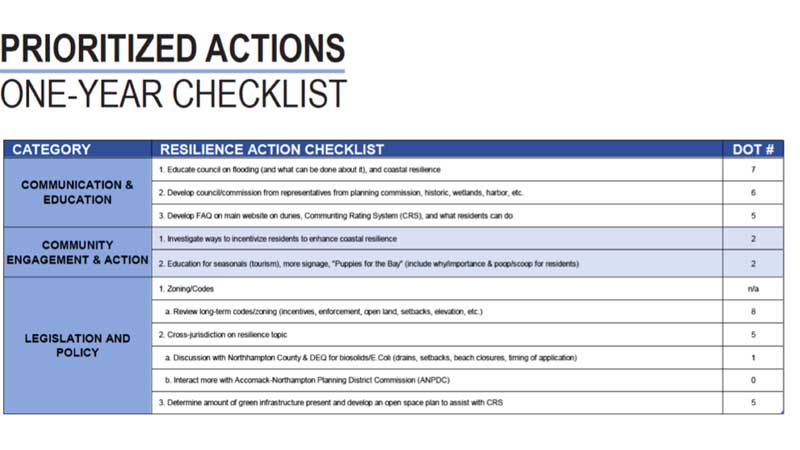
Below are the items accomplished so far on the checklist:
- Green infrastructure potential with the goal of developing an open space plan.
- Studying dunes along the town beach relative to legal status and importance.
- Photographic documentation and scientific data on rising water and recurrent flooding.
- Active participant in the ANPDC’s Climate Action Working Group (CAWG).
- Incentivize local residents and businesses to be more resilient and plan for rising water and recurrent flooding.
- Studying potential impacts from rising water and recurrent flooding on residential and commercial tax revenues.
- Cape Charles Museum and Welcome Center on last fall’s “Water Ways” exhibit as part of the Smithsonian Institution’s Museum on Main Street program.
- Public information update articles in several editions of the Gazette.
Currently, town Staff and the RAFT partners are looking at green infrastructure potential with the goal of developing an open space plan. This will be valuable if the town moves forward to lower our Community Rating System score (currently at 9). The RAFT partners are studying the dunes along the town beach relative to legal status and importance. They will also be leveraging the work done last year by our Dune and Wetlands Board. From that study, the town will be better informed about erosion control and overall maintenance of the dunes.
The RAFT partners are gathering photographic documentation and scientific data on rising water and recurrent flooding.

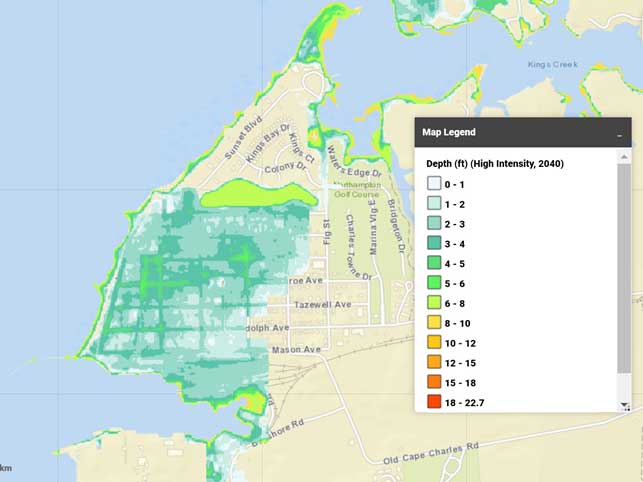
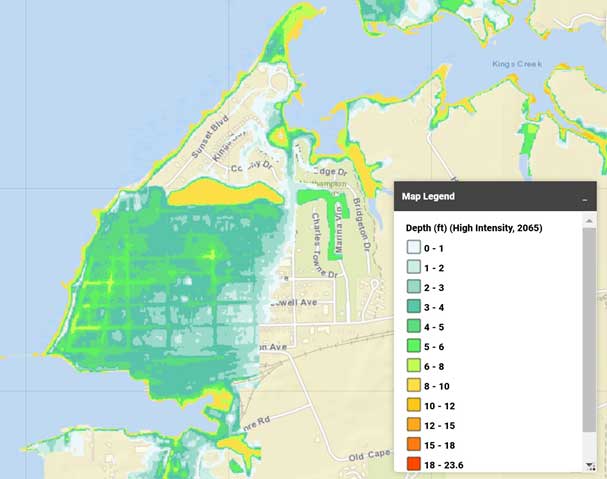
Water depth ranges from less than 0.5 ft to greater than 4 ft in the port, coastal dune edge, and northern peninsula.
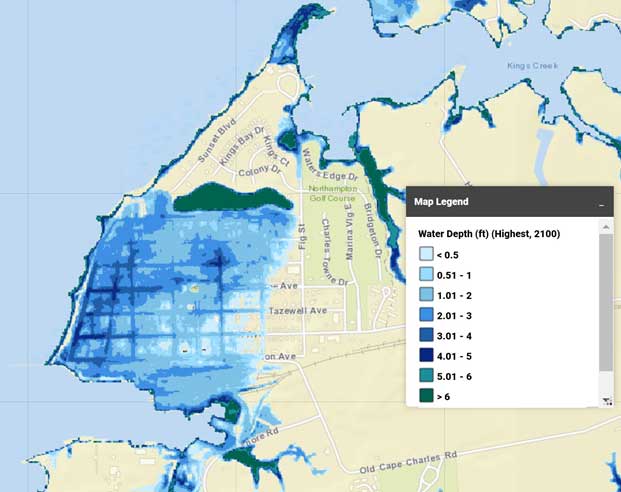
Water depth ranges from less than 0.5 ft. to 4-5 ft. in Historic District, up to more than 6 ft. in port, coastal dune edge, northern peninsula and north side of Washington Ave.
Next Steps
Staff is an active participant in the Accomack-Northampton Planning District Commission’s Climate Action Working Group (CAWG). Town Staff and the RAFT partners are looking at ways to incentivize local residents and businesses to be more resilient and plan for rising water and recurrent flooding.

Resilience & Adaptation Feasibility Tool (The RAFT) team from the William & Mary Virginia Coastal Policy Center and Old Dominion University.
Sounds like a liberal ‘Wet Dream”.
How is it possible that “RAFT Scorecard for Cape Charles, the average is 8.” as claimed in the first illustration? While the resolution of the image is pretty bad, It looks to me like the average of the numbers in the chart would be either 3.9 or 4.1 (really hard to read on of the figures). Is the chart incomplete?
Note: Peter, please go back to the article for clarification. Town Planner Larry DiRe sent in a correction and data.
Mr. Helek,
I’m going to contact Wayne this morning about the language in the article regarding the checklist. The numbers next to the priority list represent the number of votes (literally done by placing dots next to the item choices during the June 26, 2017 workshop) received as a priority item. They do not represent the community rating score (CRS) which is 9. One of the RAFT goals is to lower that CRS score. As stated at the meeting the lowest (scaled from highest 10 to lowest 1) CRS score for any jurisdiction in Virginia is 6. Hope this helps, and please feel free to contact my office if you have any questions or require more information. Thanks for taking the time to read, think about this, and comment.