NOAA has just released its report on US Commercial Fisheries and the Seafood Industry.
U.S. COMMERCIAL LANDINGS
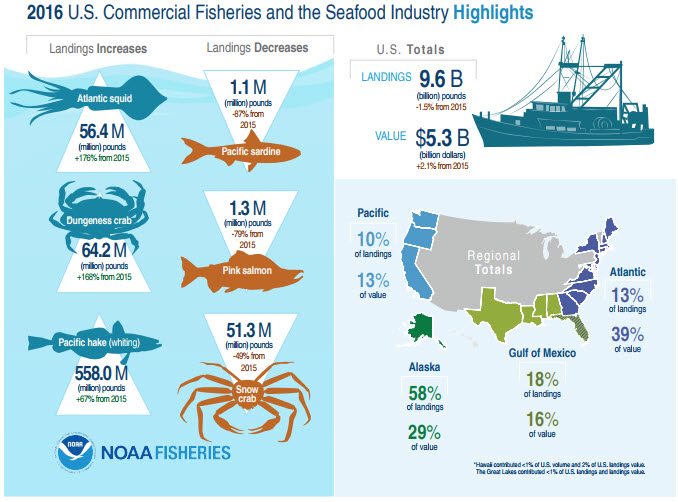
Commercial landings (edible and industrial) by U.S. fishermen at ports in the 50 states were 9.6 billion pounds or 4.3 million metric tons valued at $5.3 billion in 2016—a decrease of 145.6 million pounds (down 1.5%) and an increase of $108.7 million (up 2.1%) compared with 2015. Finfish accounted for 88 percent of the total landings, but only 43 percent of the value. The 2016 average ex-vessel price paid to fishermen was 55 cents per pound compared to 54 cents per pound in 2015.
Catches of Alaska pollock, Pacific whiting, and other Pacific groundfish that are processed at-sea aboard U.S. vessels in the northeastern Pacific are credited as “landings” to the state nearest the area of capture. Information is unavailable for landing port or percentage of catch transferred to transport ships for delivery to foreign ports. These at-sea processed fishery products, on a round (live) weight basis, was almost 1.6 million metric tons in 2016 and made up 36 percent of the total domestic landings in the 50 states.
Commercial landings by U.S. fishermen at ports outside the 50 states provided an additional 420.4 million pounds (190,707 metric tons) valued at $277 million. This was a decrease of 23 percent, or 128 million pounds (57,912 metric tons) in quantity and a decrease of $7.2 million (2.5%) in value compared with 2015. Most of these landings consisted of tuna landed in American Samoa and other foreign ports.
Note that improved foreign port data collection in 2012 resulted in a more complete dataset, and thus higher numbers, than were historically available at the time of publication. Therefore, use caution when comparing data before 2012 to those from more recent years.
Edible fish and shellfish landings in the 50 states were 7.5 billion pounds (3.4 million metric tons) in 2016—a decrease of 266 million pounds (120 metric tons) compared with 2015.
Landings for reduction and other industrial purposes were over 2 billion pounds (947 thousand metric tons) in 2016—an increase of 6 percent compared with 2015.
AQUACULTURE
In 2015, estimated freshwater plus marine U.S. aquaculture production was 627.4 million pounds with a value of $1.4 billion, an increase of 19.6 million pounds (3.2%) in volume and $61.5 million (4.6%) in value from 2014. Atlantic salmon was the leading species for marine finfish aquaculture, with 47.5 million pounds produced an increase of 6.3 million pounds (15.2%). Atlantic salmon produced was valued at $87.7 million (up 15.2%). Oysters have the highest volume for marine shellfish production (35.2 million pounds, up 5.7%).
The United Nations Food and Agriculture Organization (FAO) estimates that nearly half of the world’s consumption of seafood comes from aquaculture. Globally, Asia is the leading continent for aquaculture production volume with 89.3 percent of the global total of 76.6 million metric tons. The top five producing countries are in Asia: China, with 62.3 percent of the global total; India, 6.8 percent; Indonesia, 5.7 percent; Viet Nam, 4.5 percent; and Bangladesh, 2.7 percent. The United States ranks sixteenth in production.
U.S. MARINE RECREATIONAL CATCH
The 2016 U.S. marine recreational finfish catch, including fish kept and fish released (discarded) on the Atlantic, Gulf, and Pacific coasts (including Alaska, Hawaii and Puerto Rico), was an estimated 371.6 million fish taken on an estimated 63.1 million fishing trips. The harvest (fish kept or released dead) was estimated at 144.6 million fish weighing 181.6 million pounds.
PER CAPITA CONSUMPTION
Estimated U.S. per capita consumption of fish and shellfish was 14.9 pounds (edible meat) in 2016. This total was a decrease of 0.6 pounds from the 15.5 pounds consumed in 2015.
CONSUMER EXPENDITURES
U.S. consumers spent an estimated $93.2 billion for fishery products in 2016. The 2016 total includes $63.4 billion in expenditures at food service establishments (restaurants, carry-outs, caterers, etc.).
Full Report can be downloaded Here


*The Philippines is currently the country that dumps the most plastic into the ocean, with an estimated 360,000 tons of…
prove it. sounds like a fox news talking point.
Because the price of bags and straws are already worked into the price of the products you buy and the…
Why doesn’t Northampton County ban the use of plastic bags, for starters?
spot on