Karen Gay is the Eastern Shore of Virginia Weston A. Price Foundation chapter leader. Consider joining our ESVA Weston A Price Foundation Chapter Facebook Group: https://www.facebook.com/groups/esvawapf/. For more information contact Karen at karengreergay@gmail.com. All are welcome!
Anyone here go to Woodstock? I remember when it was happening, but I sure don’t remember that there was a flu pandemic going on. The American Institute for Economic Research released an article on May 1, 2020 which describes the environment at the time. Here is an excerpt and link to the article in case you’d like to read the whole thing:

Reading this article got me thinking about this year’s pandemic and how it measures up to pandemics in the past in terms of data. Oddly, in looking across mainstream media news sources, I don’t see this data front and center which we should all be talking about because no matter where the viruses come from, we know, given time, that we’ll get another pandemic. Whether we should require people to quarantine themselves and businesses to shut down or allow people to exercise their judgement given that they know their susceptibility is a question that we need to debate with all of the data at hand.
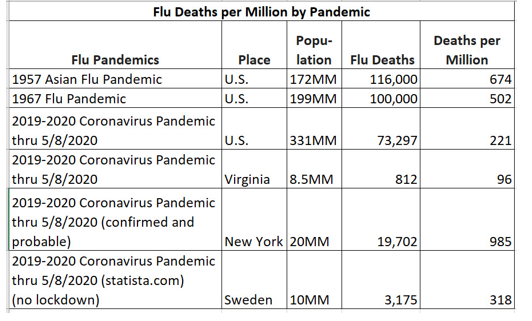
Here are two charts that I put together from CDC and Departments of Health websites. The first one, Flu Deaths per Million by Pandemic, compares the 1957-1967, and today’s pandemic in terms of deaths per million. The deaths from Coronavirus represent a point in time, and more will occur as weeks pass. You can see that the flu deaths from the 1967 pandemic were 502 per million, while to-date, the U.S. has suffered 221 deaths per million from the flu/Coronavirus. Virginia has done much better at 96 deaths per million from flu/Coronavirus while New York has had a devastating 985 deaths per million. Sweden falls somewhere in the middle at 318 deaths per million and this country did not require its citizens to stay home.
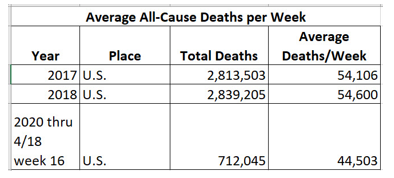
There’s another way to look at this data, which is total deaths by week. This is useful because there have been many articles describing how deaths from Coronavirus are inflated. Even if we don’t record enough deaths from Coronavirus this chart takes all deaths from the United States from 2017 and 2018 and compares them to deaths in 2020. For 2017 and 2018, I divided the total deaths by 52. For 2020, I divided the deaths by 16. You can see that all-cause deaths are way down, no doubt because people are staying inside and are not subject to as many car and workplace accidents. This data comes from https://www.cdc.gov/nchs/nvss/vsrr/covid19/index.htm.
So, for once, I’m not going to spout off what I think about this data. You can look at it and decide for yourselves whether government intervention was warranted. There are other factors involved, like the virulence of the virus, the susceptibility of the aged and the fact that the quarantine did prevent some cases of Coronavirus. The question is whether it was worth the cost of lost income, lack of access to needed surgeries, and human contact.
You decide.
